

The BioProtect CO2 Calculator is a web application designed to help fishers estimate emissions linked to individual fishing trips. It combines operational data with catch information to provide fast feedback on total emissions and emissions intensity.
A first version of an application will be developed and deployed to vessel operators in the Norway and Iceland DSs. This application will calculate CO2 emissions during fishing operations. It will use information about the vessel and gear characteristics, the fuel, lubricant, and coolant used, and the weight of the catch. The application will calculate the kg of CO2 per kg of landed fish and offer simple reporting and graphing features.
Progress so far
During the first 18 months, the BioProtect team designed and built the first version of the BioProtect CO2 Calculator as a practical tool for fishing operations. Early work focused on defining a realistic user workflow, identifying the trip data that fishers could provide, and designing a calculation logic that could translate those inputs into CO2-equivalent emissions.
Our partners then implemented the calculator as a web application with modular components for vessel setup, trip entry, trip history and visualisation. At the same time, work was carried out on assembling and encoding suitable placeholder emission factors for fuel, lubricants and coolants, drawing on life-cycle assessment data and earlier fisheries projects in Iceland and Norway.
Before month 18, the prototype underwent several rounds of mock testing using real-life data from previous projects and benchmark comparisons with LCA-based estimates. These activities helped refine the calculation engine, improve the front-end, reduce bugs and make the data-entry process more intuitive for future fisher testing.
What this delivered
These activities led to the first prototype of the BioProtect CO2 Calculator, a working web application ready for alpha testing in the Iceland demonstration site. Prototype v1 already allows users to record trip data, calculate emissions and review results in a simple, near real-time format.
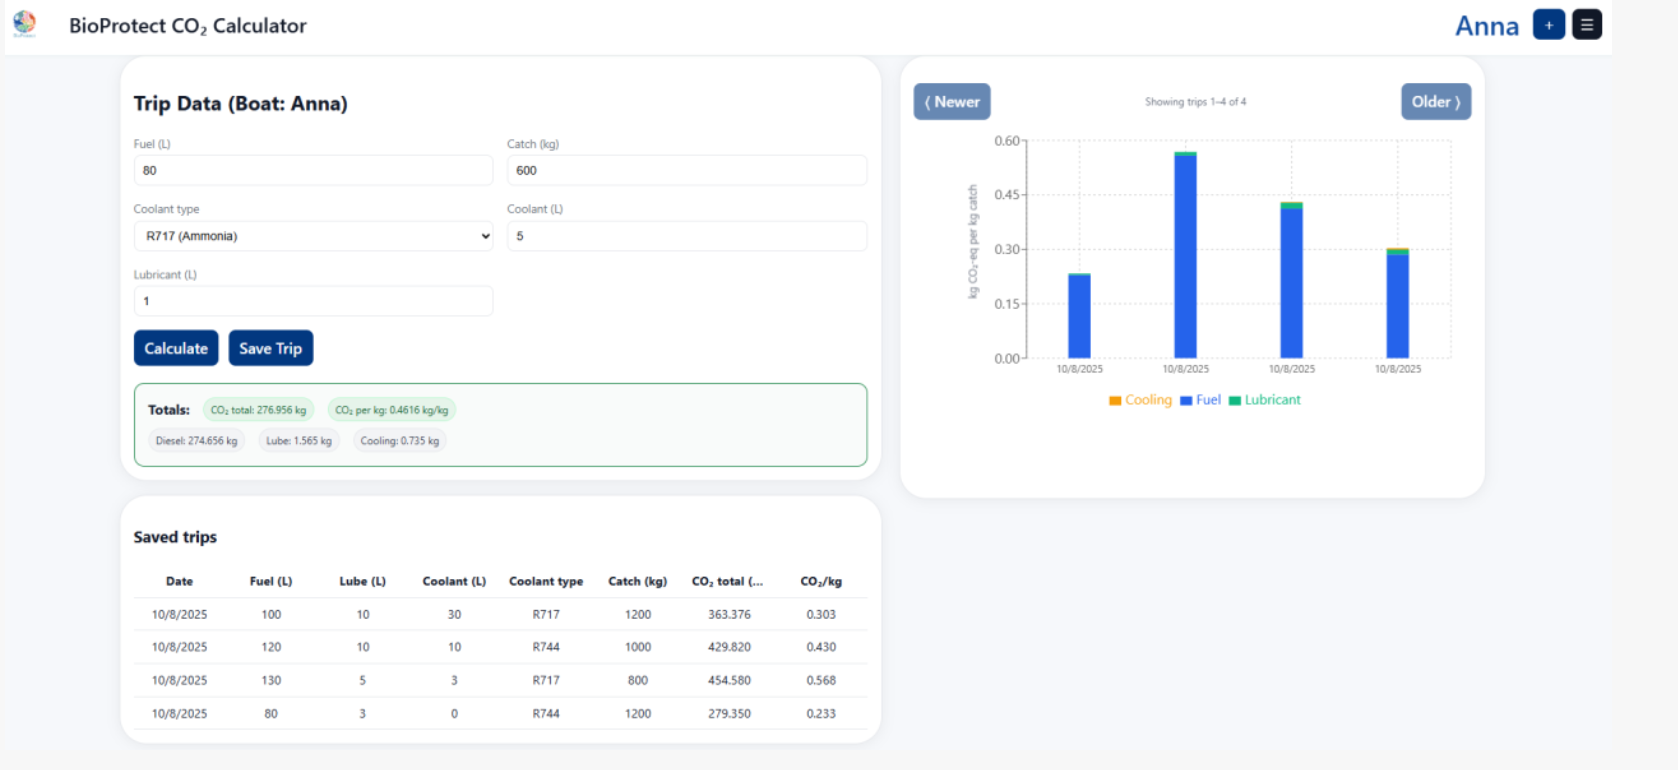 Fig 1. Example of the front-end of the web application. This figure shows how the different components described above interact together in the user interface.
Next steps
The next phase will test the calculator with fishers, beginning in Iceland and later extending to Norway, while also exploring interest from New Zealand. Feedback will be used to improve both the front-end and the calculation model, with future options including additional functions, language versions, offline use and wider digital integration.