

Public Participation Geographical Information System (PPGIS) is a method that engages and mobilises citizens in decision-making processes, while delivering spatial information and knowledge of high enough quality for conservation and planning purposes.
BioProtect has developed a first version of an interactive web application, called the BioProtect PPGIS Analyser visualising digital citizen mapping data.
The BioProtect PPGIS Analyser will analyse and visualise spatial data from PPGIS tools about perceived threats and risks to coastal community areas. This user-friendly, web-hosted app will standardize procedures for assessing response biases and processing data to analyze the distribution of features mapped by the communities.
The app will include analytical tools such as heatmaps, DBSCAN clustering, Maxent, Bayesian additive regression trees, and digital text analysis tools like structural topic modeling, which account for participant characteristics.
Progress so far
During the first 18 months, the BioProtect team translated participatory mapping needs into a concrete analytical workflow. Work focused on identifying the main analytical requirements for PPGIS data, including the need to process both spatial and non-spatial information in a consistent and user-friendly way.
Based on these needs, the team designed and developed a web-based, open-source application using Shiny in R. Development concentrated on implementing and testing a first set of core analysis modules, including non-spatial summaries, mapped point visualisation, heatmaps, clustering, Likert-scale analysis and basic text analysis through word clouds.
Internal testing helped refine how these modules were organised and displayed, with the aim of making results easier to interpret for non-specialist users. In parallel, the team defined the next development roadmap, including predictive modelling functions, broader language flexibility and long-term hosting arrangements.
What this delivered
These activities led to the first prototype of the BioProtect PPGIS Analyser, now available as a working web application. Prototype v1 already brings together essential analytical tools for exploring community-mapped survey data in a more standardised and accessible way.
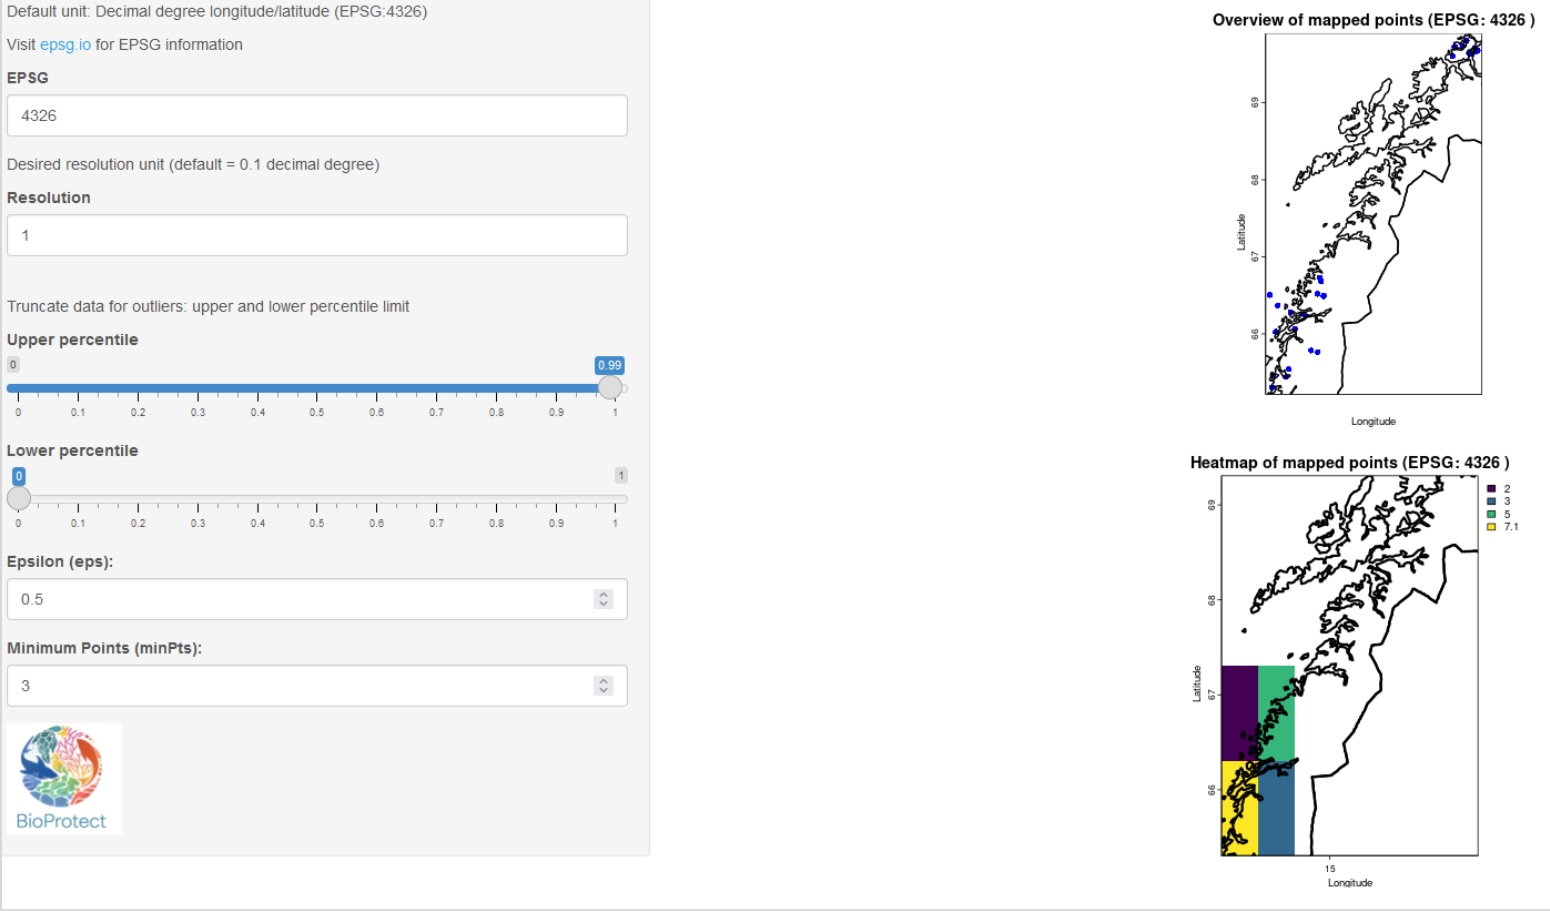 Fig 1. Example output of the “Spatial data” tab
The first prototype of the BioProtect PPGIS Analyser allows users to visualise mapped survey responses through heatmaps and clustering, helping identify areas of stronger community interest or concern, as seen above.
Next steps
The next phase will refine the tool based on internal testing and partner feedback, with a strong focus on usability and outreach. Future development will expand predictive functions, improve text-analysis flexibility and support long-term accessibility through hosting on UiT servers.
Check out this ArcGIS StoryMap and dive deeper into the use of the BioProtect PPGIS Analyser!